About us > Carbon Footprint > Energy Carbon Footprint

Energy Carbon Footprint
Since 2015 we have been actively recording our energy carbon footprint and taking measures to reduce it in support of both Church of England's initiatives and our own Eco Church pledge.
Currently the footprint includes gas and electricity use at our two main buildings, the Cathedral and Cathedral House, that together make up the bulk of our energy consumption. Our initial target of a 20% weather-adjusted energy carbon emissions reduction by 2020 against a 2013 base year was achieved a year early in 2019, and as the table below shows, that reduction is now close to 40%.
We aim from 2025 to include emissions for clergy housing energy use and all Cathedral related reimbursable travel, to align with the Church of England net zero carbon 2030 scope. We intend to also adopt a new 2030 target for weather-adjusted emissions against a base year footprint of 2019 for the enlarged scope to ensure a continued focus on energy efficiency in a warming climate.
Energy carbon emissions and energy expenditure/income: Cathedral and Cathedral House
|
Energy carbon emissions and energy spend 2013-2023: Cathedral and Cathedral House |
|||||
|
|
2023 |
2022 |
2021 |
2019 |
2013 |
|
Scope 1 – Gas consumption tCO2e |
59.59 |
66.91 |
87.08 |
92.51 |
120.87 |
|
Scope 2+3 – Purchased grid electricity tCO2e |
11.23 |
9.21 |
10.33 |
16.72 |
46.68 |
|
Total energy GHG emissions tCO2e (1) |
70.82 |
76.11 |
97.41 |
109.23 |
167.55 |
|
Actual change v 2013 base year |
-58% |
-55% |
-42% |
-35% |
|
|
Carbon intensity tCO2/m2 floorspace occupied |
0.023 |
0.024 |
0.031 |
0.035 |
0.054 |
|
Total weather-adjusted GHG emissions tCO2e (2) |
83.62 |
92.98 |
99.03 |
119.46 |
151.30 |
|
Weather-adjusted change v 2013 base year |
-45% |
-39% |
-35% |
-21% |
|
|
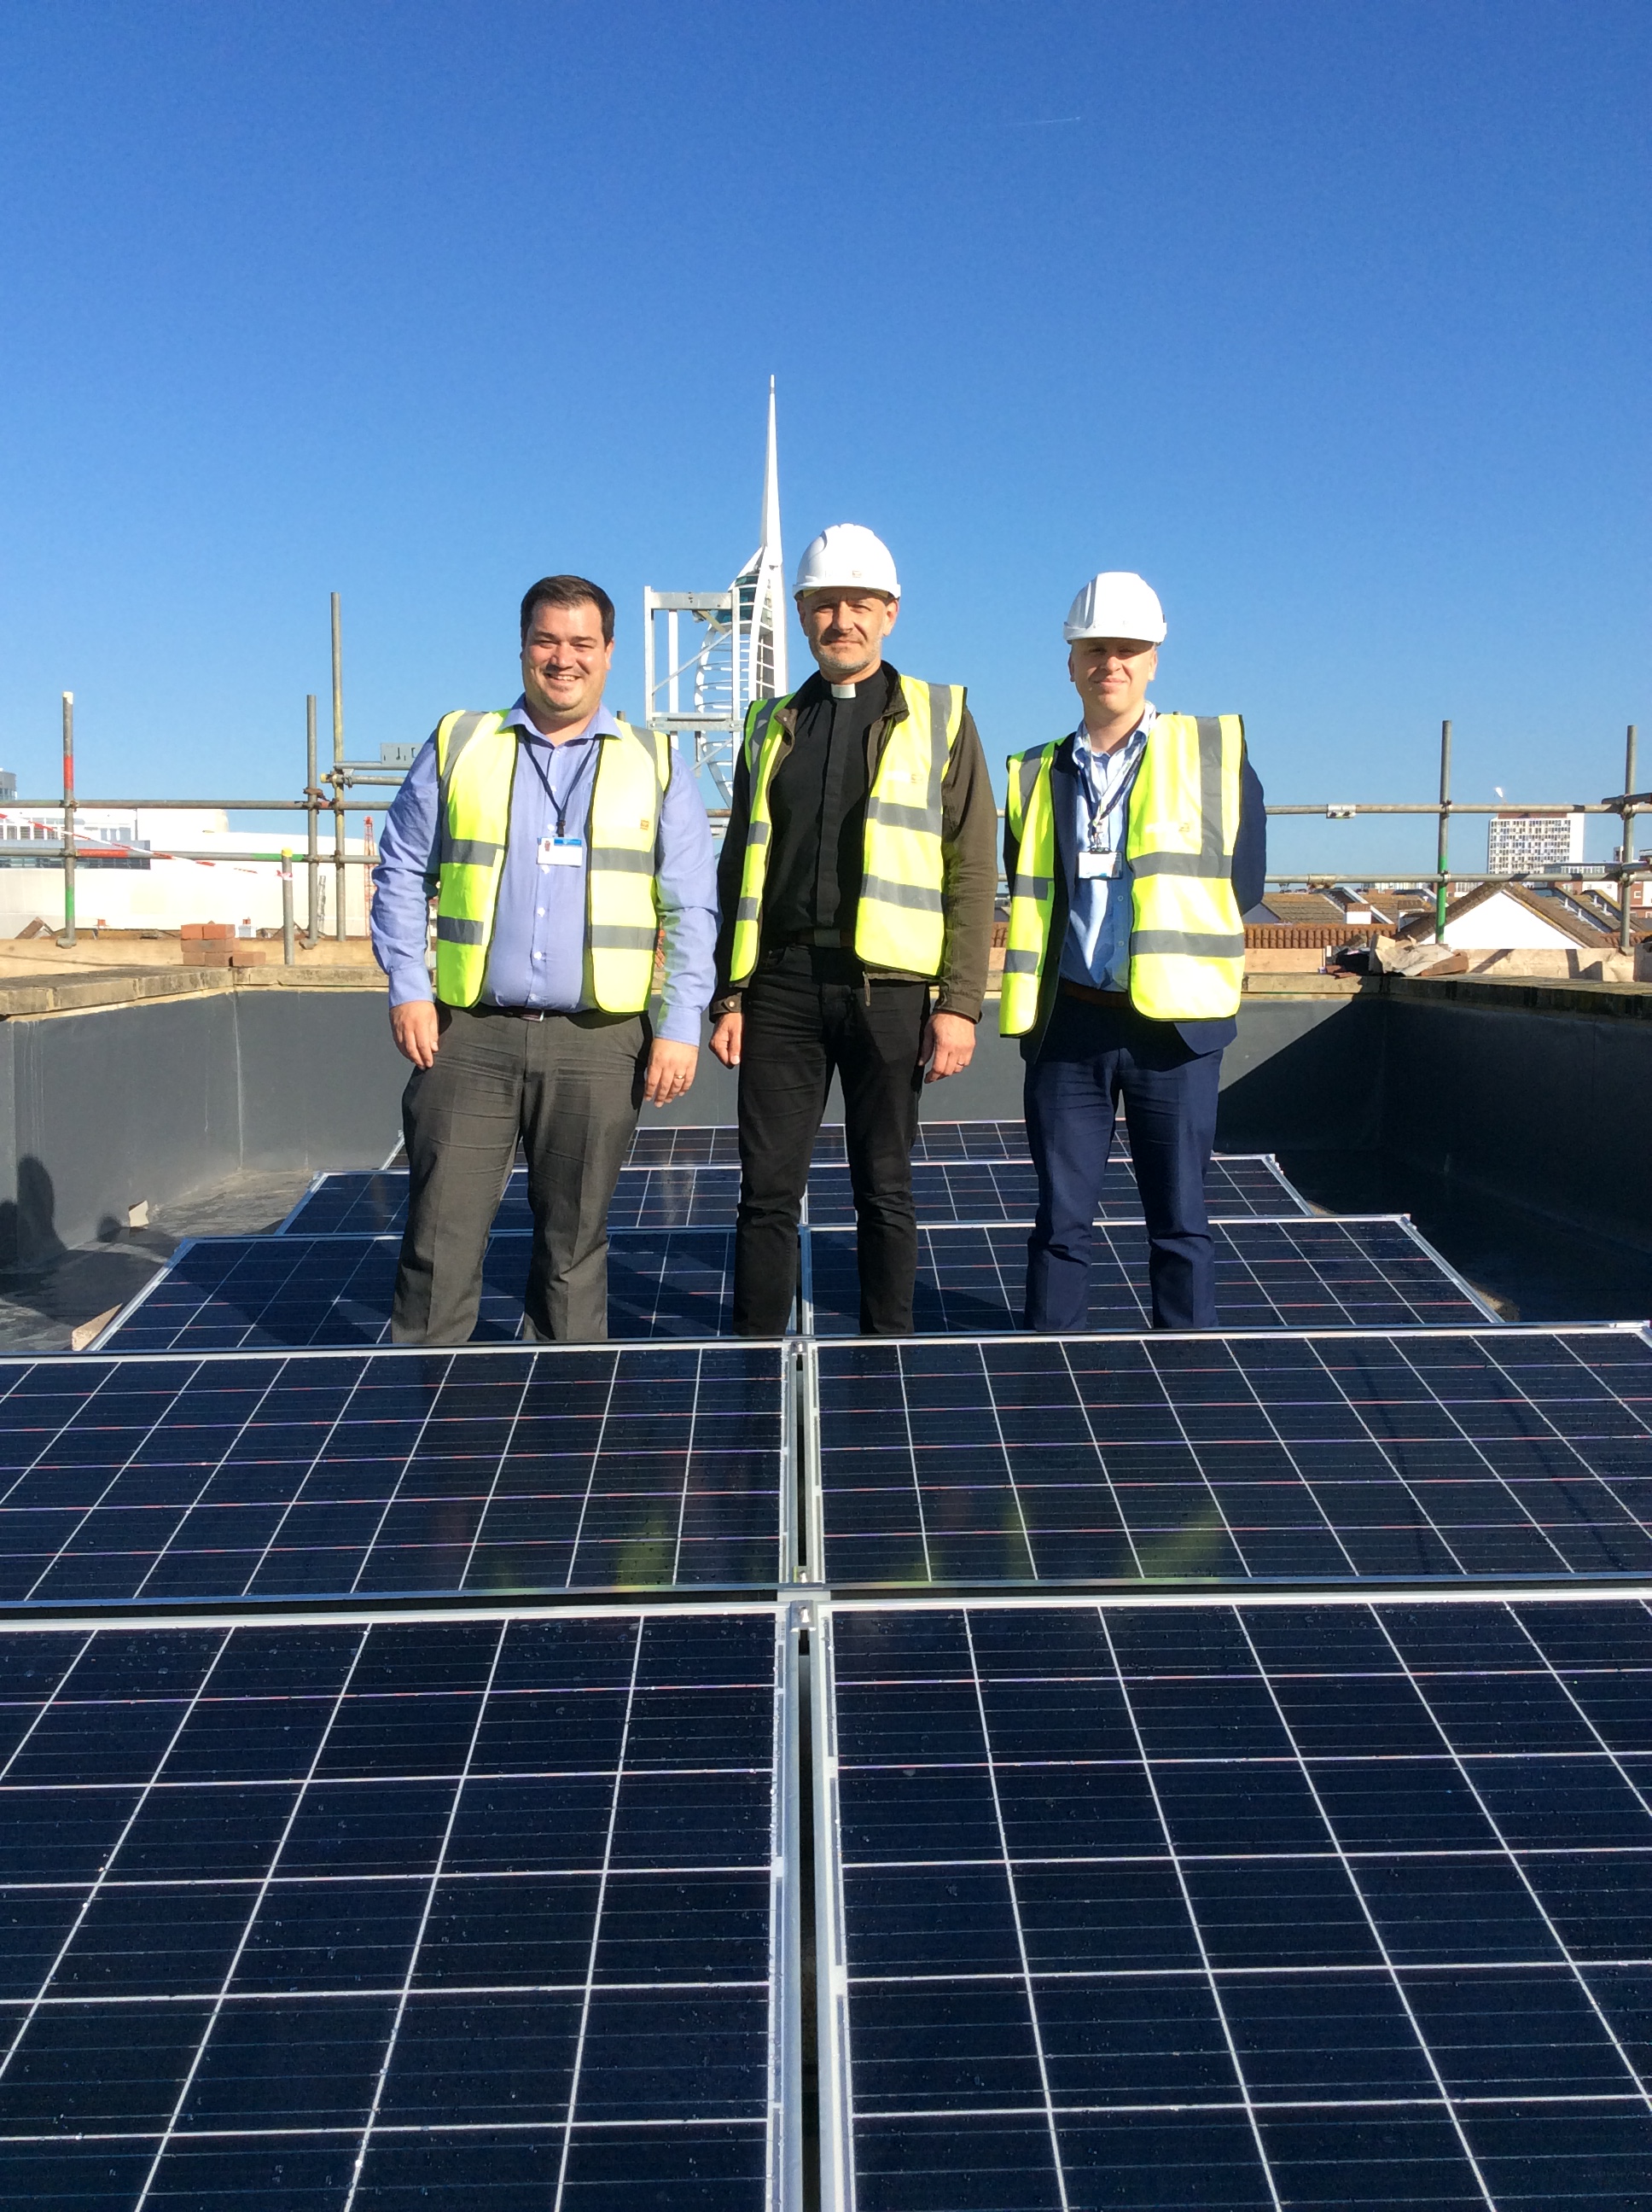
Onsite low carbon electricity generation kWh |
|
18,598 |
18,745 |
18,679 |
0 |
|
Purchased energy expenditure gross |
£37,105 |
£23,016 |
£22,820 |
£30,761 |
£37,868 |
|
FIT income from onsite electricity generation (3) |
£1,687 |
£2,812 |
£2,576 |
£2,668 |
£0 |
|
Energy expenditure net of FIT income |
£35,418 |
£20,204 |
£20,244 |
£28,093 |
£37,868 |
(1) Applying the relevant UK Government GHG reporting conversion factors to kWh of energy consumed
https://www.gov.uk/government/publications/greenhouse-gas-reporting-conversion-factors-2021
(2) Applying also the relevant annual weather adjustment using the Stark heating degree day dataset
https://www.stark.co.uk/degree-days-for-free/
(3) Feed-in tariff (FIT) income earned under the UK microgeneration framework
You may also be intereste in…